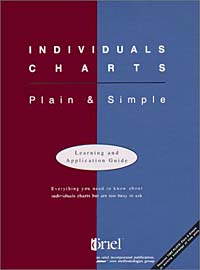
Individual Charts explains how to quickly detect specific types of process changes by adding statistical control limits to time plots. The information is presented in a straightforward, easy-to-understand manner through a series of exercises and case studies. Users learn how to select the right tool for the task at hand, collect the right data, interpret the data, and take appropriate action based on their findings. Это и многое другое вы найдете в книге Individuals Charts: Plain & Simple (Joiner Associates Staff)
Individuals Charts: Plain & Simple Joiner Associates Staff
Подробная информация о книге «Individuals Charts: Plain & Simple Joiner Associates Staff». Сайт не предоставляет возможности читать онлайн или скачать бесплатно книгу «Individuals Charts: Plain & Simple Joiner Associates Staff»
